Green warming stripes visualize the effects of climate change

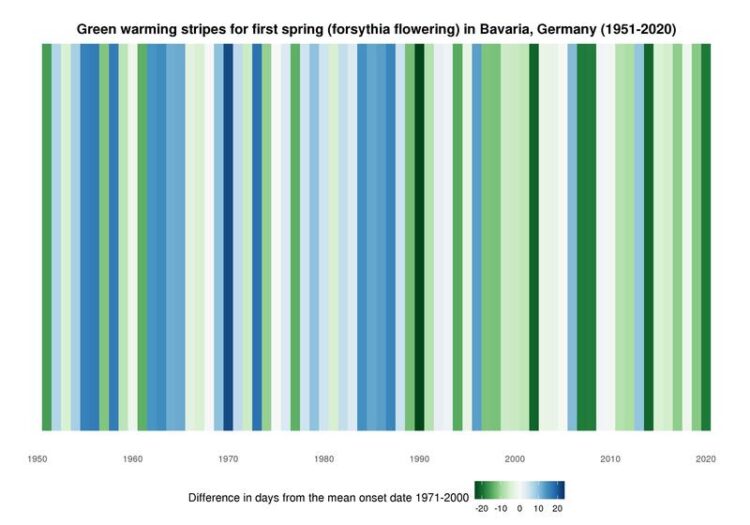
This example of the new display format shows the forsythia bloom in Bavaria from 1951 to 2020. In recent years, it can be observed earlier and earlier.
Ye Yuan & Annette Menzel / TUM / Baysics.de
To illustrate the effects of climate change on nature at a glance, scientists at the Technical University of Munich (TUM) are now presenting Green Warming Stripes for the first time. Annette Menzel, Professor of Ecoclimatology at the TUM, explains in an interview how we can interpret them and what they mean.
We understand that Green Climate or Warming Stripes can illustrate nature’s responses to global warming, but how can we decode the colored stripes?
Blue colors represent years with cold weather and their consequent later flower or leaf development. Green Stripes represent warm years with earlier plant development. We have created the Green Warming Stripes for Bavaria and some historical observation series in other areas of Central Europe.
Many people probably know similar images – only in different colors- from the coverage of the “Fridays for Future” demonstrations…
The Green Climate Stripes or “Green Warming Stripes” are a further development of the well-known “Warming Stripes” by Ed Hawkins, which simply visualize the warming over the last decades in blue and red color and communicate it without frills.
What exactly are the new “Green Warming Stripes” about?
Phenological events such as leaf unfolding, flowering, and fruit ripening are a perfect bioindicator of climate change. They advance by up to 5 days for every 1 degree Celsius of warming. Take the hazel blossom in Bavaria, for example. In recent years, hazel blossoming has been observed more than 20 days earlier than in the period between 1971 and 2000. The Green Warming Stripes thus perfectly compliment the purely temperature-based Warming Stripes because they impressively show the directly observable effects of climate change on nature. For example, earlier flowering of allergenic plants means a longer period of suffering for pollen allergy sufferers, and budding of trees in April instead of May is associated with a higher risk of late frosts.
The images currently available cover a fairly wide range of phenological changes. Do you plan to create more stripes for other regions or phenophases?
Green Warming Stripes are currently available for several phenological seasons in Bavaria and some other historical 120-year time series such as the cherry blossom at Geisenheim in the German Rheingau. In plant phenology, the year is not divided into four seasons but into ten “phenological seasons”: Early, First, and Full Spring; Early, Mid and Late Summer; Early, Full, and Late Autumn; and Winter. This classification is based on the phenomena in the plant world with regard to flowering as well as fruit ripening, leaf coloration, and leaf shedding. For example, hazel blossoming indicates the phenological season early spring, while horse chestnut fruit ripening marks full autumn. We plan to expand the range of Green Warming Stripes step by step to include additional historical time series and other regions.
More information:
The Green Warming Stripes are available and can be downloaded from the project website www.baysics.de of the Bavarian Synthesis Information Citizen Science Portal for Climate Research and Science Communication.
BAYSICS is a collaborative project in the Bavarian Network for Climate Research that aims to make climate change tangible for citizens in their own environment. Using a web application or app, participants can record observations of plants, allergenic species, tree borders, and animals and thus contribute to the observational treasure trove. Their own observations can be correlated with existing data sets and observations from other users thereby demonstrating where and how climate change is affecting our everyday lives.
Wissenschaftliche Ansprechpartner:
Prof. Dr. Annette Menzel
Professorship of Ecoclimatology
Phone: +49 8161 714740
e-Mail: amenzel@wzw.tum.de
Originalpublikation:
Weitere Informationen:
http://www.baysics.de
https://www.tum.de/nc/en/about-tum/news/press-releases/details/36528/
https://www.professoren.tum.de/en/menzel-annette
https://www.oekoklimatologie.wzw.tum.de/index.php?id=1&L=1
Media Contact
All latest news from the category: Ecology, The Environment and Conservation
This complex theme deals primarily with interactions between organisms and the environmental factors that impact them, but to a greater extent between individual inanimate environmental factors.
innovations-report offers informative reports and articles on topics such as climate protection, landscape conservation, ecological systems, wildlife and nature parks and ecosystem efficiency and balance.
Newest articles

First-of-its-kind study uses remote sensing to monitor plastic debris in rivers and lakes
Remote sensing creates a cost-effective solution to monitoring plastic pollution. A first-of-its-kind study from researchers at the University of Minnesota Twin Cities shows how remote sensing can help monitor and…

Laser-based artificial neuron mimics nerve cell functions at lightning speed
With a processing speed a billion times faster than nature, chip-based laser neuron could help advance AI tasks such as pattern recognition and sequence prediction. Researchers have developed a laser-based…

Optimising the processing of plastic waste
Just one look in the yellow bin reveals a colourful jumble of different types of plastic. However, the purer and more uniform plastic waste is, the easier it is to…


