Virtual globes visualise the Earth's environment

<br>
Dr Jon Blower from the University of Reading and colleagues were awarded `Best Paper' at the UK e-Science All Hands Meeting in Nottingham this week for their paper describing how such virtual globes can aid scientific research and communicate results to a wide public. “This is more than just eye candy,” said Dr Blower. “Visualisation is extremely important for revealing new information about environmental processes from the local level right up to the global scale.”
Google Earth is a computer-based 3D representation of the Earth on which you can superimpose your own information. Based on satellite imagery, it can also show you, rather alarmingly, an image of your house from space. The Reading scientists have used it, however, to visualise two or more scientific datasets simultaneously.
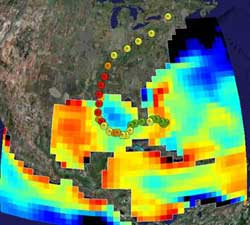
Figure 1 shows how the passage of Hurricane Katrina affected sea surface temperature in the Gulf of Mexico. One dataset shows sea surface temperature, with red colours being warmer. The other tracks the passage and intensity of the hurricane, with red dots representing greater intensity. “The image shows that the hurricane caused the sea on the right-hand side of the storm to cool, which is where the strong winds would have caused upwelling of colder subsurface water,” says Dr Blower. “You can also see the hurricane grow in strength as it picks up energy from the warm ocean.” A video revealed precisely how the storm and the sea affect each other.
Google Earth is also helping environmental scientists to test their models against real data. Figure 2 shows at a glance whether a model of the ocean is good at predicting what is actually observed. Green dots indicate that the model's predictions of temperature and salinity accord well with measurements recorded by ships and buoys. The red pins, which are mainly located in the turbulent Gulf Stream, are not such a good match. “A virtual globe allows the scientist to view the data at a huge range of scales. Sometimes a global overview is appropriate and sometimes the scientist needs to zoom in to a region where observations are very closely spaced,” says Dr Blower.
In another application, scientists from the British Antarctic Survey are displaying real-time data in Google Earth to help them direct scientific missions. The movement of penguins recorded by scientists in the field, for example, is being combined with satellite images of nutrient concentrations to plot where the penguins, and hence the scientists, should be heading next, helping to make the most efficient use of time and resources on scientific cruises.
“These virtual globes are particularly useful for bringing data together visually to explore ideas before embarking on a detailed study. For example a scientist could quickly bring together data feeds to investigate the effects of weather on outbreaks of disease. There are thousands of examples of how virtual globes can help us to generate and explore new ideas about how the world works”, said Dr Blower. Future work could extend the capabilities of virtual globes, enabling them to visualise undersea and underground data.
Professor Jie Xu of Leeds University who chaired the AHM programme committee said: “This is an excellent survey on the hot topic of using virtual globes to visualise and share important environmental data, supported by interesting and realistic application examples.”
Media Contact
More Information:
http://www.rcuk.ac.ukAll latest news from the category: Ecology, The Environment and Conservation
This complex theme deals primarily with interactions between organisms and the environmental factors that impact them, but to a greater extent between individual inanimate environmental factors.
innovations-report offers informative reports and articles on topics such as climate protection, landscape conservation, ecological systems, wildlife and nature parks and ecosystem efficiency and balance.
Newest articles

Largest magnetic anisotropy of a molecule measured at BESSY II
At the Berlin synchrotron radiation source BESSY II, the largest magnetic anisotropy of a single molecule ever measured experimentally has been determined. The larger this anisotropy is, the better a…

Breaking boundaries: Researchers isolate quantum coherence in classical light systems
LSU quantum researchers uncover hidden quantum behaviors within classical light, which could make quantum technologies robust. Understanding the boundary between classical and quantum physics has long been a central question…

MRI-first strategy for prostate cancer detection proves to be safe
Active monitoring is a sufficiently safe option when prostate MRI findings are negative. There are several strategies for the early detection of prostate cancer. The first step is often a…


